SUNDAY
MONDAY
TUESDAY
WEDNESDAY
THURSDAY
FRIDAY
SATURDAY
1
2
2
2
3
2
8
2
9
2
10
2
5
2
4
2
6
2
7
2
29
2
28
2
30
2
31
422
498
513
525
433
510
572
660
619
572
514
544
558
678
620
459
441
394
429
444
511
486
480
520
590
445
467
517
430
410
456
539
488
459
430
2
15
2
16
2
17
2
12
2
11
2
13
2
14
2
22
2
23
2
24
2
19
2
18
2
20
2
21
2
29
2
30
2
1
2
26
2
25
2
27
2
28
2
Last Minute Prices
within
Days
Fixed
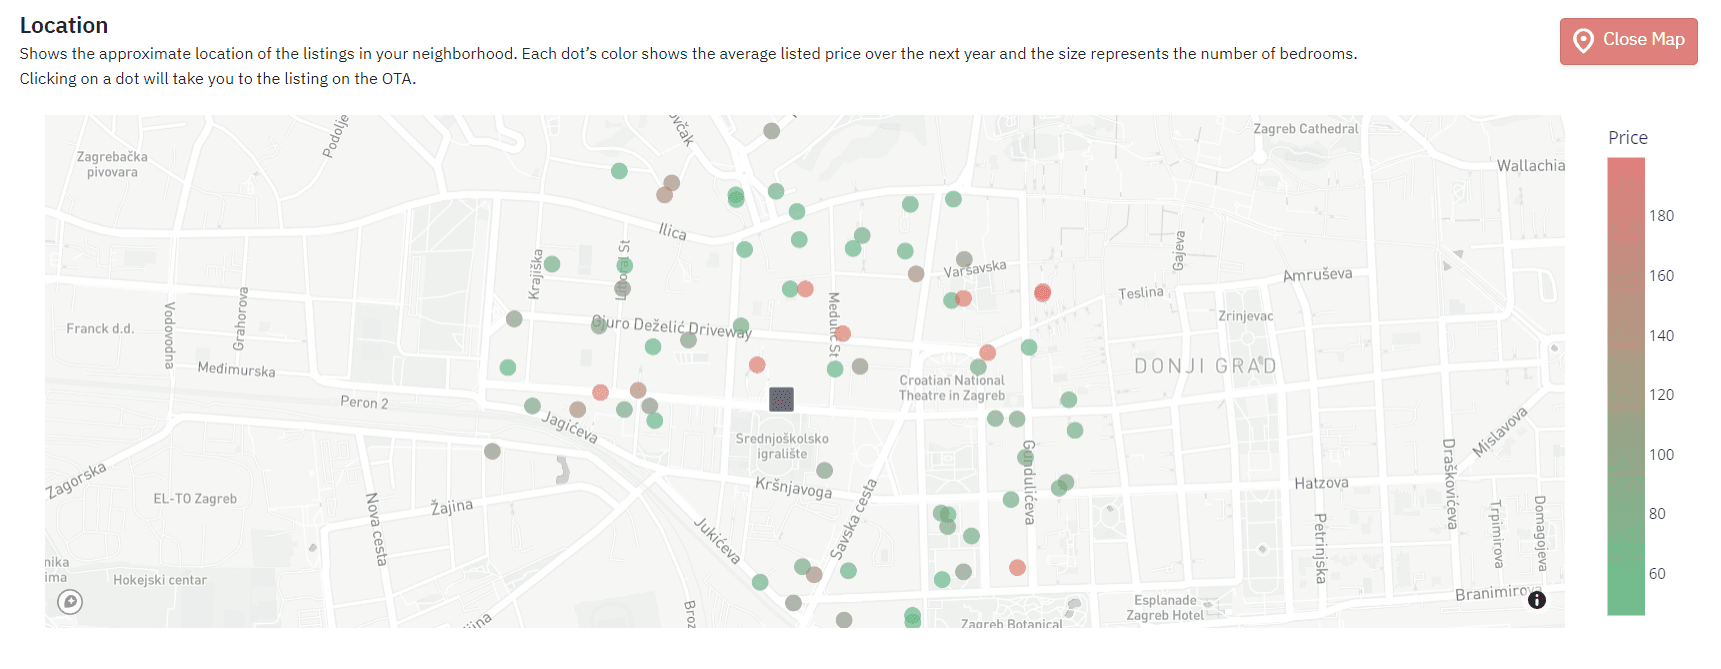
Market Dashboard
Make Confident Decisions Backed by Market Data
Latest Market Data
Build personalized dashboards with the location's listing data to identify trends & patterns to optimize the pricing, occupancy and stay length strategy
Compare with Competition
Compare with nearby properties with similar number of bedrooms, amenities and prices with advanced filter to create custom comp sets
Discover more about Market Dashboards
Dashboard
Bedroom Filter
Apply
Future Occupancy , Bookings
Future Prices
Dashboard
Bedroom Filter
Apply
Market Summary
Avg. Revenue
Avg. RevPAR
Listing Map and Comp Sets
Dashboard
Bedroom Filter
Apply

Listing ID : 506041
Export Report PDF
Preferences
Generate PDF
Price
Occupancy
Key Performance Indicators
Compare
Dates
Revenue
Occupancy(%)
No of Reservations
1.37M
82.72
1.52K
For
< 2019- 2030 >
2019
2023
2027
2020
2024
2028
2021
2025
2029
2022
2026
2030
Portfolio Analytics
Vital performance indicators at your fingertips
Track Performance
Track your properties’ performance with a real-time reporting system with KPIs like Occupancy Rates, ADR, RevPAR and many more factors
Pacing Data
Compare your booking rate with last year and the market to make informed decisions for each property
Discover more about Portfolio Analytics
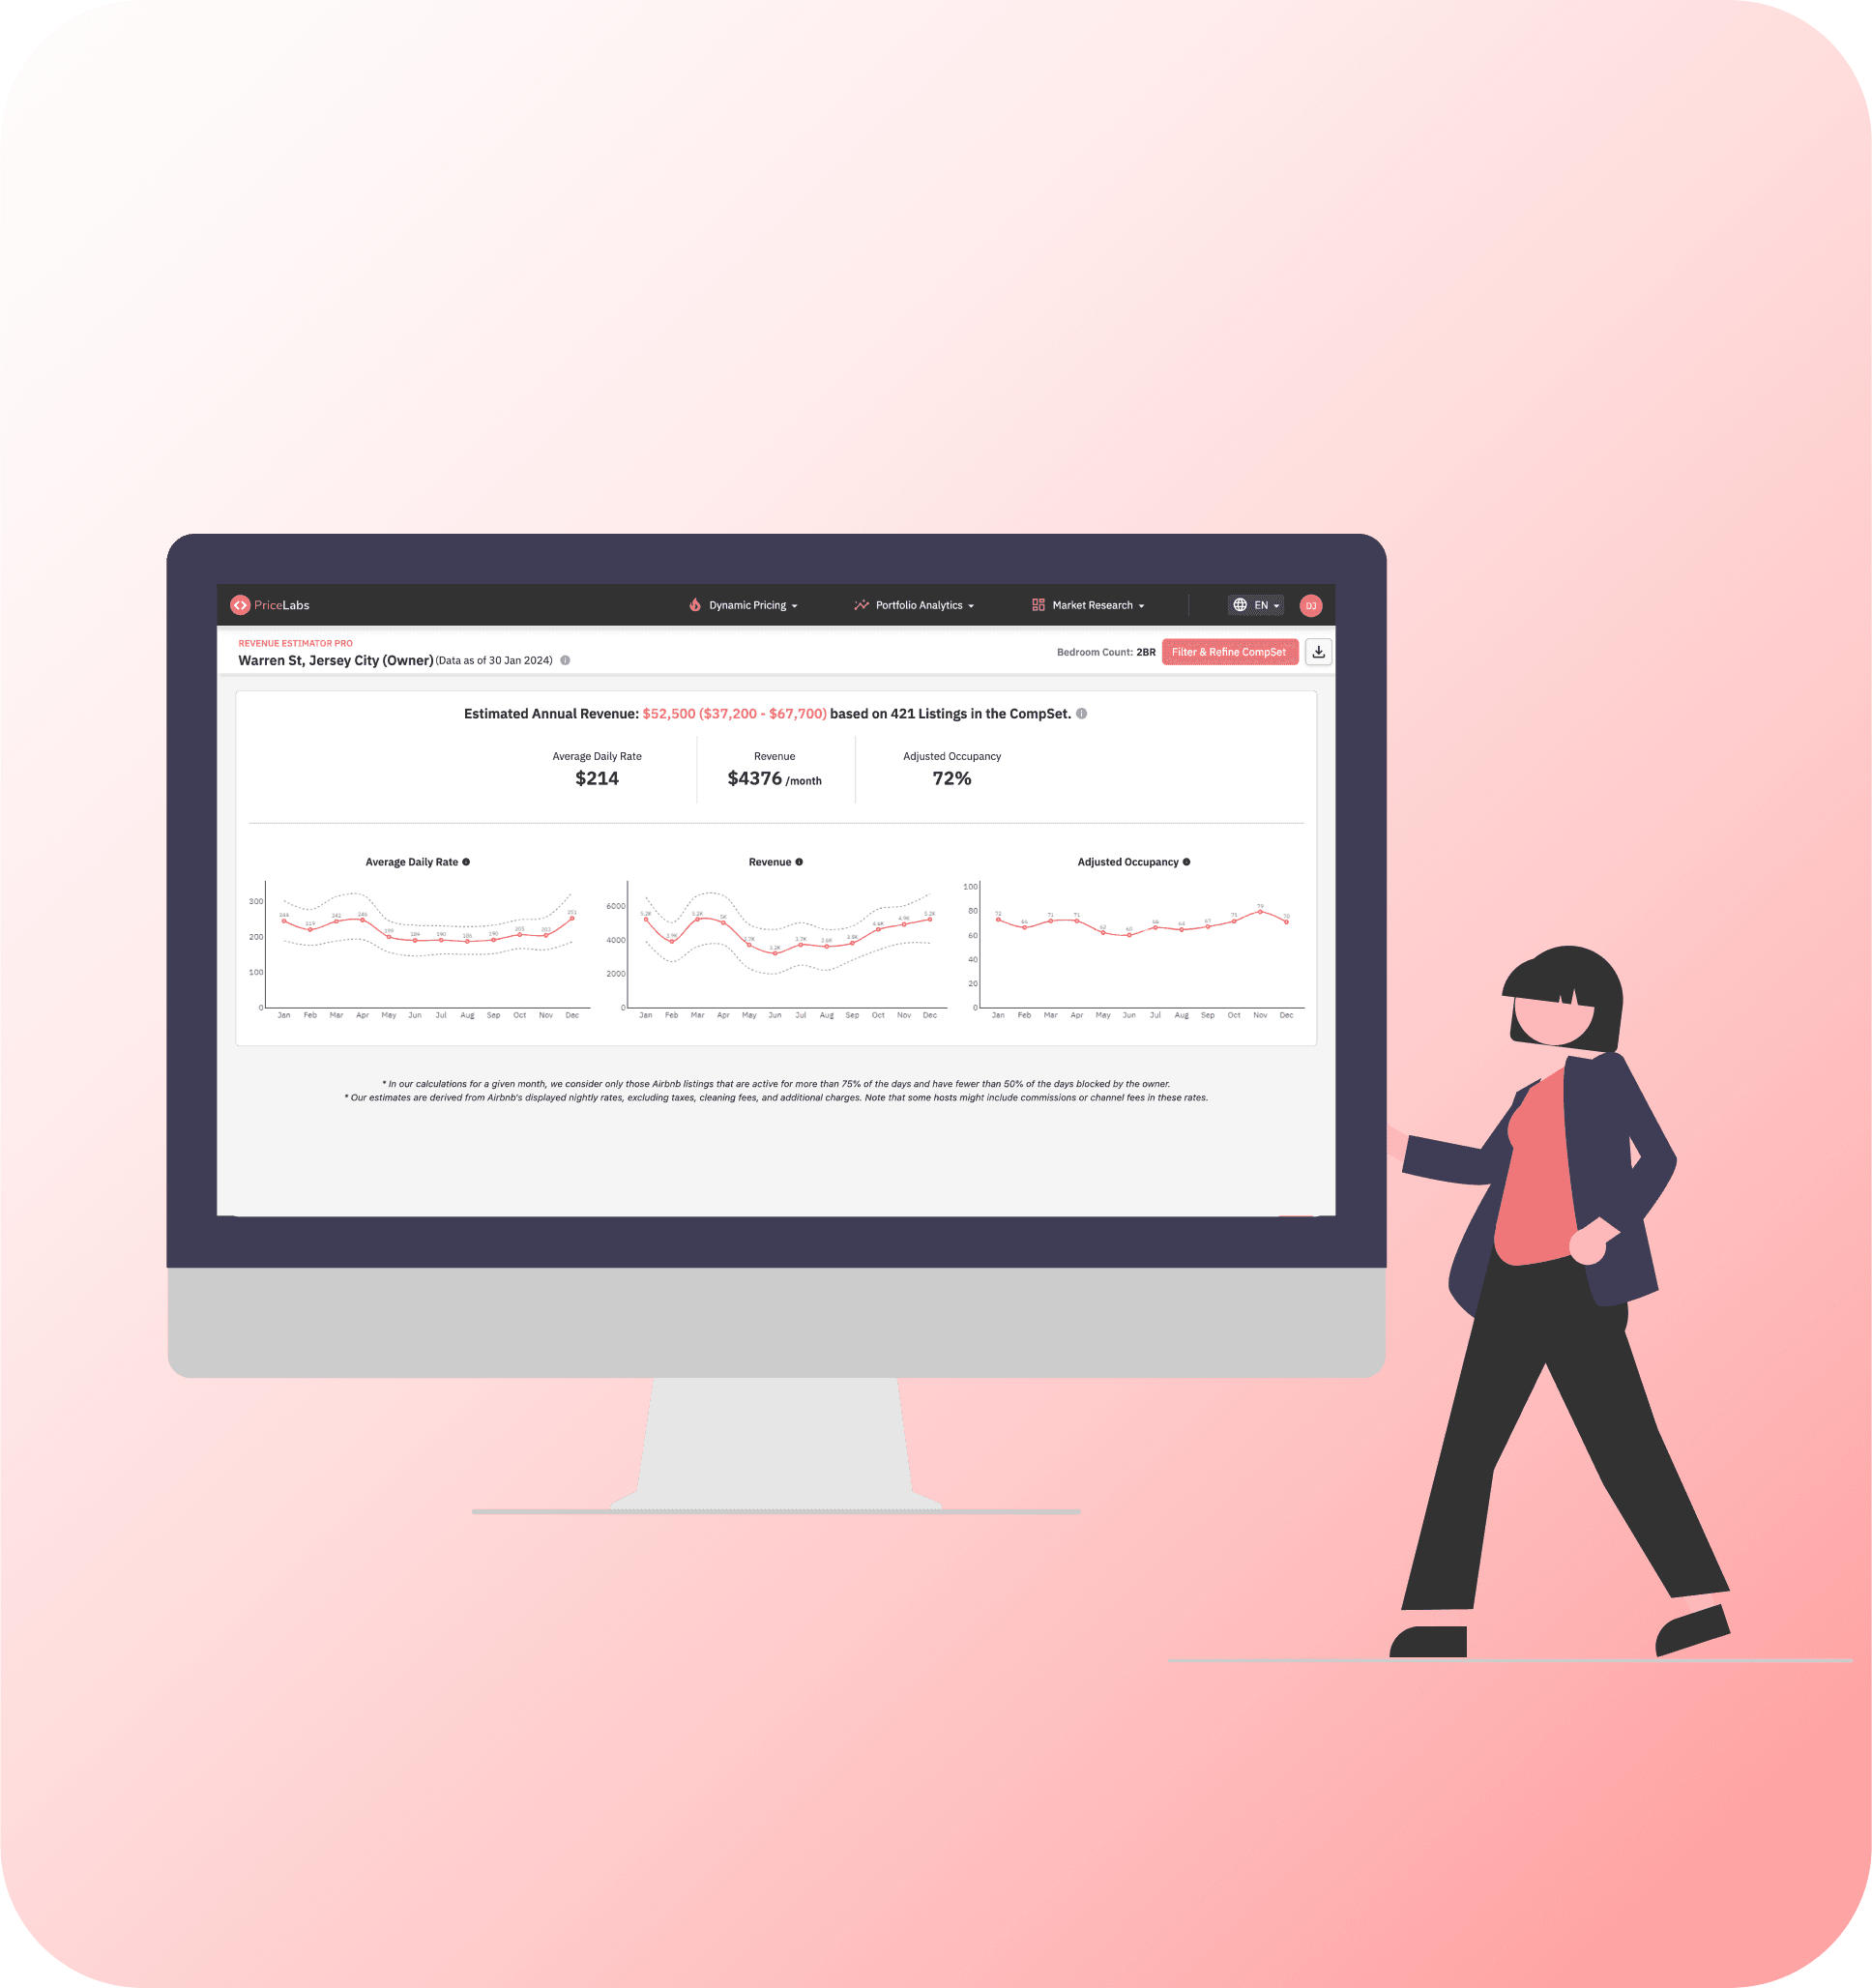
Revenue Estimator Pro
Discover Any Property’s Earning Potential in Minutes
Track Performance
Track your properties’ performance with a real-time reporting system with KPIs like Occupancy Rates, ADR, RevPAR and many more factors
Pacing Data
Compare your booking rate with last year and the market to make informed decisions for each property
Discover more about RevenueEstimator Pro
Try our Dynamic Pricing Tool
30 Day Free Trial
Start Trial Now
Product Demo
Watch Demo
Want to talk to us?
Get in touch
Here’s why owners and property managers 💖 PriceLabs


Terry Whyte
Saviani Nunes
Annette & Sarah
Polivios
Christian
PriceLabs is a superior pricing platform with excellent customer service. There’s no denying what PriceLabs has done for me. There’s no way I can make those kinds of accurate predictions on my own. PriceLabs has impacted both my occupancy and my ADR positively.
Since adopting PriceLabs, my attention has shifted towards monitoring and analyzing behavioral patterns rather than merely reacting to individual actions. This shift has relieved me of many concerns and granted me the luxury of dedicating more time to shaping our broader strategic business choices.
A member of our community; there was an event in her town and PriceLabs was telling her to price it at $650. She had never priced above $250 and she was almost certain PriceLabs was giving an incorrect recommendation. She was sure she would never get that price. But she did! She TRIPLED her nightly rate thanks to PriceLabs. She was mind-blown!
Having a lot of rental properties is a nightmare to adjust the prices. This software its saving me a lot of time and is doing better job that i will ever do myself. I cant recommend it enough.
Compared to other price optimization services PriceLabs offer so many functionalities. My company manage 200+ Airbnb rentals and after our start with PriceLabs we've seen a big increase in revenues as well as a smaller work load for us. The team is extremely friendly and helpful only adding to the experience. I can highly recommend PriceLabs.
50+ properties, Property Manager & Owner,
Anna Maria Island Beach Rentals, USA
25+ properties, Co-Founder and Managing Partner,
Achei Gramado, Brazil
25+ properties, Co-founders,
Thanks for Visiting, USA
Shanxi, China
Shanxi, China
Increase Revenue And Occupancy With PriceLabs' Dynamic Pricing And Revenue Management Tool
We work with
Airbnb, VRBO, Vacation Rentals, BnBs, Apart-Hotels, Serviced Apartments

30-day free trial. No credit card. No commitment.
Total Revenue
60,870 $
38 %
Occupancy
Booking Rate
Maximize your revenue with intelligent price recommendations and Hyper-local market data
10.66M
Revenue
124
3.62
129.97
Average Length of Stay
RevPAR
0.13
-22.3
7 Days
30 Days
60 Days
0
70
85
Listing’s Health
Bookings made in last
30 Days
14 Days
7 Days
Max
Dynamic Pricing
Now with Hyper Local Pulse (HLP), our pricing algorithm that uses hyper local market data to make accurate pricing decisions
Customizable Data-Driven Pricing
Intelligent price recommendations considering market trends like supply, demand, seasons, events, and holidays, with full control over the final prices
Advanced Minimum Stay Intelligence
Optimize booking duration with helpful recommendations specific to each property
Time-saving Workflows
View and update multiple properties in bulk with Multicalendar, CSVs or APIs to save valuable time
Discover more about Dynamic Pricing
June 2025
Base Price
Max Price
Min Price

452 $
800 $
370 $
Check In
Booked
Unbookable
Min-stay
Overrides
Low Demand
Normal Demand
Good Demand
High Demand
Unavailable
Increase Revenue With Data-Driven Pricing
Manage Prices And Availability Easily With Data-Driven Insights And Automation Rules
Apply Filter
Cancel
R
S
1
2
3
4
5
10
Bedroom Filter
Based on listings around you
66%
68%
LISTING
Occupancy Rate (60 Days)
MARKET
40 USD
70 USD
100 USD
130 USD
Bedroom categories
Confirm Base Price
2
Custom
Manually input a Base
Price
Recommended
$120
Market Median
$123
Current Base Price : 120
Median Price : 123
Base Price Help
Powered by
Hyper Local Pulse Algorithm

A truly global revenue management solution
100+ Countries
Properties priced daily
275,000+
hosts & property managers trust us
35,000+
Start your free trial
Products
Pricing
Resources
Integrations
Use cases
Contact
Log In
Start your free trial